| To View the Live Point Display |
| To Store Point Display Data |
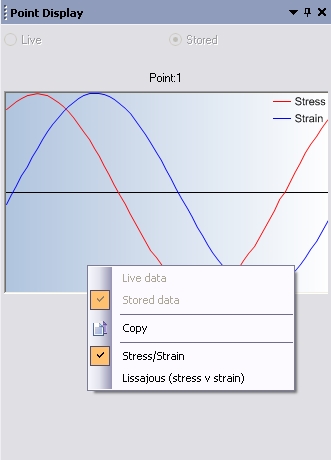
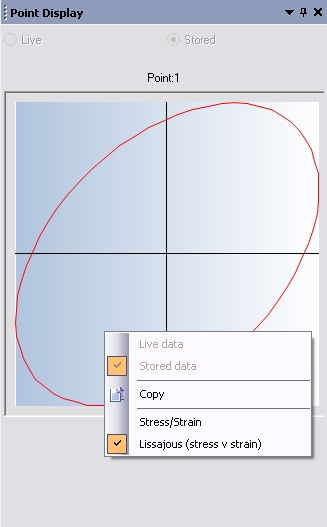
| To View Stored Point Display Data |
| Orthogonal Oscillation Tests |
The Point Display provides a “virtual oscilloscope” that allows operators to monitor the stress (torque) and strain (angular displacement) waveforms as they are being generated during an oscillation experiment. This feature visualizes a reduced version of the raw stress and strain data being generated, provides a graphical monitor of the data quality, and allows you to look for signs of distortion in the sine waves. Such distortions are an indication of non-linear behavior from the sample or from sample clipping (which might be due to torque overload or loss of contact between sample and test fixture).
The Point Display option is available inside the experiment Data acquisition menu for the following test modes:
The data of the point display can be saved with each data point. The Save waveform (point display) checkbox is available in the Data acquisition menu of all oscillation experiments. The Point Display represents a composite of the raw data acquired and can be displayed either as a small graphic with strain or stress versus time or as stress vs. strain with 64 to 1024 data points (depending on the instrument).
The Point Display can be displayed live during an oscillation/flow test or can be retrieved from a TRIOS data file (when saved was enabled) by selecting an oscillation/flow data point in the graph or the table. A symbol representing a graph displays next to the row number of a spreadsheet when the Point Display data has been saved during the experiment.
While an experiment is in progress, select Point Display from the Instrument Control panel.
Point Display data collected during an experiment can be stored for later viewing by performing the following instructions prior to running a test:
Stored Point display data can be viewed in a Point Display window that can be opened from the Experiment tab. Position the Point Display window to your preference on the TRIOS workspace.
When OSP oscillation tests are performed (Rotation and 2D), the raw waveform data are collected for the angular displacement and the axial displacement. The angular live strain/stress data are always shown on the Instrument Control panel. The axial live wave form data (normal stress/strain) are always shown on the alternative Point display used for stored data points viewing. Note that the document with the current experiment needs to be in focus in order to activate the live option button on the alternative Point display form.
Stored stress/strain and normal stress/strain data can also be viewed in this form anytime.
